Prediction
The use of AutoML as a planning and forecasting tool is made easier by Aclysis. Consider important business factors including sales, revenue, costs, commodity price, agent commission, disease detection, employee attrition, crop suggestion, fertiliser recommendation, etc. Historical data can be used to create a model. Learn how to use the AutoML/AutoML entitlement right away to improve your capacity to identify diabetes individuals.
Background
Predicting is one of the most well-liked machine learning applications. Future earnings, expenses, product costs, expenses, commodity costs, churn, attrition, disease detection, success, failure, lead score, etc. can all be predicted using this method.
It's actually challenging to forecast. Traditional approaches need a lot of labour, data engineering know-how, and statistical competence. Even teams without technical know-how can forecast values rapidly and affordably by using this analytical podium.
Healthcare Industries find it challenging to detect diseases for the patients with desired accuracy to apply proper remedial measures. The organisation is striving to develop a model that would enable them to diagnose individuals with certain diseases in order to exercise appropriate treatment to have higher rate of recoveries. The wellbeing and satisfaction of a patient must be ensured.
In the sections that follow, we'll look at how to create and utilise a prediction model using a dataset to identify individuals who are likely to suffer from diabetes.
An important use-case that identifies the patient with diabetes in order to ensure medical remedies. Anyone can properly build their HR Management using these assumptions.
Data in hand
TThe data consists of details of 583 patients collected from pathological laboratory. Among those, ‘’Diabetic’’ is our target / dependent variable and we can use machine learning to detect diabetic patients from a new set of individuals.
For demo purposes, this dataset has already been uploaded to Aclysis. But by just selecting "Connect Data Source," you can upload whatever dataset you desire.
We'll look at how to create and use a predicting model below. You must first log in with us. The home page will appear as.

Once you click "Add New Model" on the home page, the interface shown below will appear.

Then, select "Import Table" to upload the dataset. When a dataset is uploaded, you will see a scrollable preview of it in addition to an overview that lists the dataset's name, number of rows and columns, most recent upload time, and distribution of each variable. Click "Save & Continue" to go to the next step."

Building the Model
In order to rename columns, eliminate unused features and duplicate rows, handle outliers, etc., we can now choose the second step, "Manipulate Data." The display will be

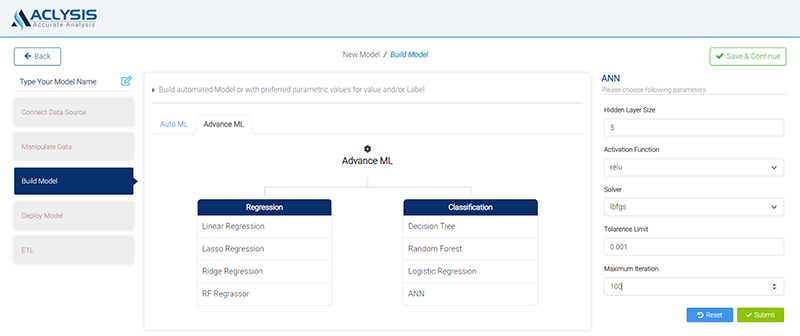
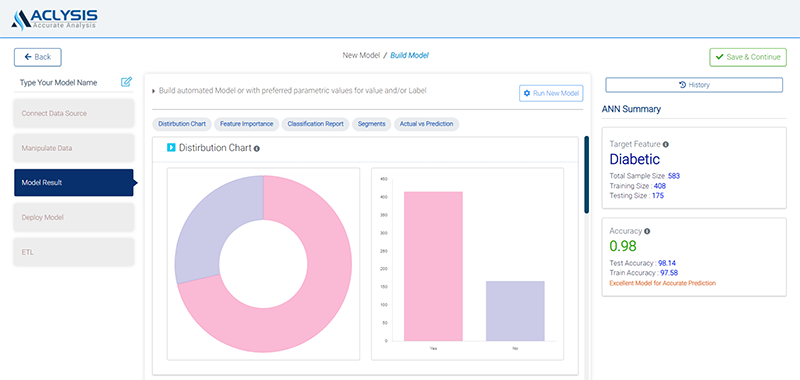
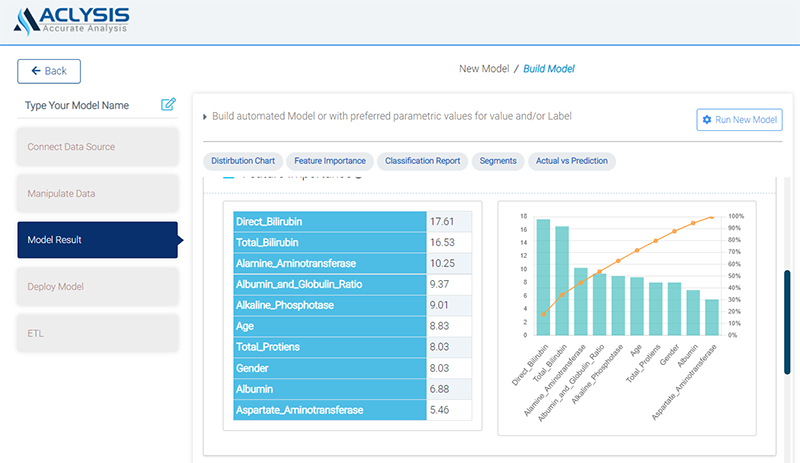
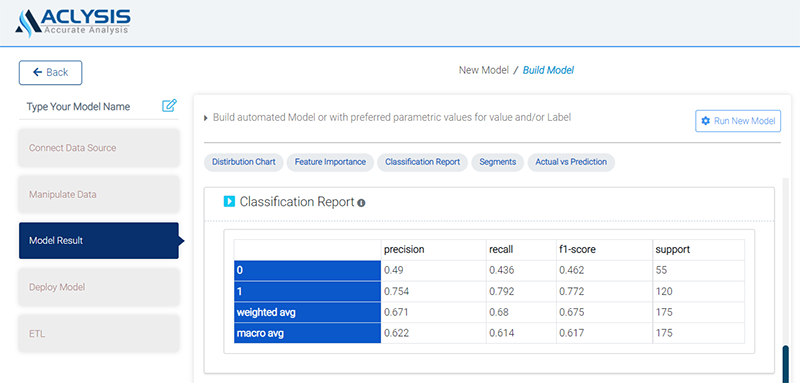
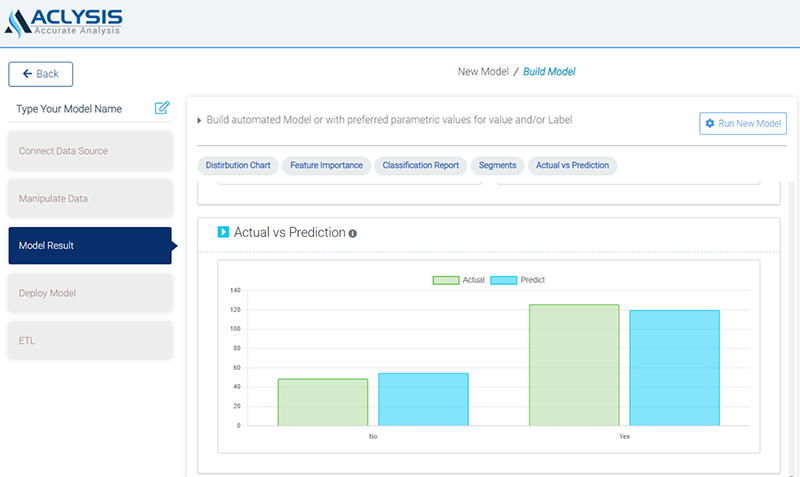
Click "Save & Continue" to move on to step 3, "Model Result," where a model is created and results are collected. In this stage, you must decide the features to include in the model as well as the target variable. You can choose from a wide range of models. You must choose the parameter values before running the advanced model. You will see the following display with model accuracy and numerous visualisations, including the target variable distribution and dispersion, feature importance, segmentations, and classification report, as soon as you submit the form. among other things, confusion matrix and an accurate vs. prediction plot.

Additionally, keep in mind that, unlike many widely used automated machine learning programmes, you are not required to pay for model training time, so feel free to create as many models as you like. As a result, we have found that developing a highly accurate prediction model is relatively simple.
Deploying the Model
IIt's time to use the model we've created in the actual world.
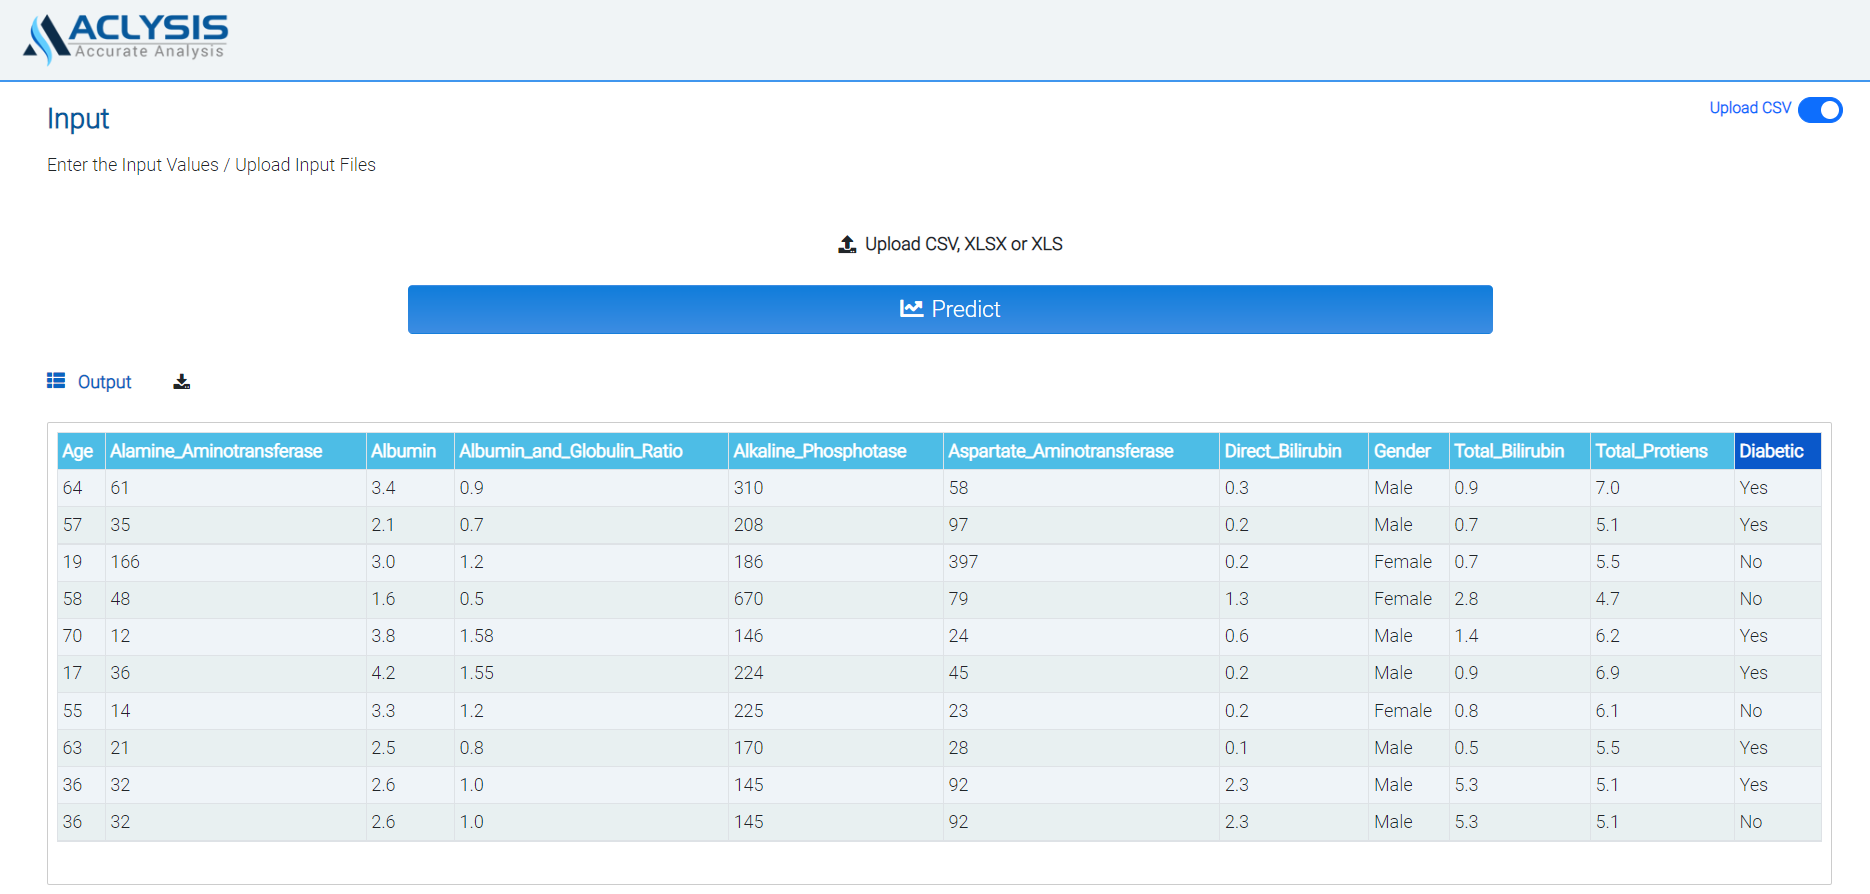
Deploying complex machine learning models is easy with Aclysis. Click "Deploy Model" to launch a web app for deployment. For instance, if you choose "Web App," you'll be prompted for feature inputs. As soon as values are given, the target variable's prediction is immediately displayed. Instead of providing a single set of numbers, you can upload a file and receive the corresponding forecasts in tabular form. Here's an illustration of a deployment page that includes a csv file:
The same techniques we used can be applied to predict any categorical trait of interest to you. As long as you have the data, you may connect historical data to Aclysis, select a column to forecast, and deploy via a variety of methods.