Employee Attrition Analysis & its importance
Businesses find it challenging to retain their current staff because of the market's enormous need for knowledgeable and skilled workers. Employee attrition can happen for several reasons. These include unhappiness about employee benefits or the pay structure, a lack of employee development opportunities, and even poor conditions in the workplace. It may be voluntary, involuntary or retirement. The organisations are striving to develop a model that would enable them to identify individuals who may be on the verge of attrition in order to maintain smooth operation and higher productivity. The wellbeing and satisfaction of a company's human resources must be ensured. Data Analytics is helpful in lowering the attrition rate of the organisation by getting to the root of the issues and then changing processes to increase effective employee retention.
Why ACLYSIS ?
One of the most popular machine learning apps is predicting. It can be used to predict future earnings, expenses, product costs, expenses, commodity costs, churn, attrition, success, failure, lead score, etc.
In fact, it's hard to predict. Traditional methods need considerable manpower, data engineering expertise and statistical knowledge. Using this analytical podium, even teams with no technical expertise can predict values quickly and cost-effectively.
In the sections that follow, we'll look at how to create and utilise a prediction model using a dataset to identify employees who are more likely to leave their jobs than others and the contributing reasons with the help of our AutoML platform with some simple clicks.
An important use-case that influences the company's position is the development of HR strategies that take into account employee behaviours. Anyone can properly build their HR Management using these assumptions.
Data in hand
The data consists of attrition details of a set of 1000 employees of a company. Among those, ‘’Attrition’’ is our target / dependent variable and we can use machine learning to predict attrition possibility for a new set of employees.
For demo purposes, this dataset has already been uploaded to Aclysis. But by just selecting "Connect Data Source," you can upload whatever dataset you desire.
We'll look at how to create and use a predicting model below. You must first log in with us. The home page will appear as.

Once you click "Add New Model" on the home page, the interface shown below will appear.

Then, select "Import Table" to upload the dataset. When a dataset is uploaded, you will see a scrollable preview of it in addition to an overview that lists the dataset's name, number of rows and columns, most recent upload time, and distribution of each variable. Click "Save & Continue" to go to the next step."

Building the Model
In order to rename columns, eliminate unused features and duplicate rows, handle outliers, etc., we can now choose the second step, "Manipulate Data." The display will be

Click "Save & Continue" to move on to step 3, "Model Result," where a model is created and results are collected. In this stage, you must decide the features to include in the model as well as the target variable. You can choose from a wide range of models. You must choose the parameter values before running the advanced model.


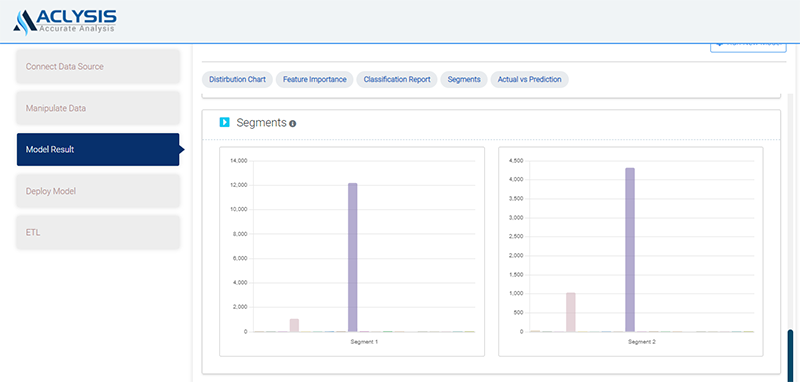
You will see the following display with model accuracy and numerous visualisations, including the target variable distribution and dispersion, feature importance, segmentations, and classification report, as soon as you submit the form. among other things, confusion matrix and an accurate vs. prediction plot.


Additionally, keep in mind that, unlike many widely used automated machine learning programmes, you are not required to pay for model training time, so feel free to create as many models as you like. As a result, we have found that developing a highly accurate prediction model is relatively simple.
Deploying the Model
It's time to use the model we've created in the actual world.
Deploying complex machine learning models is easy with Aclysis. Click "Deploy Model" to launch a web app for deployment. For instance, if you choose "Web App," you'll be prompted for feature inputs. As soon as values are given, the target variable's prediction is immediately displayed. Instead of providing a single set of numbers, you can upload a file and receive the corresponding forecasts in tabular form. Here's an illustration of a deployment page that includes a csv file:

The same techniques we used can be applied to forecast any categorical trait of interest to you. As long as you have the data, you may connect historical data to Aclysis, select a column to forecast, and deploy via a variety of methods.