Prediction
Aclysis makes it straightforward to use AutoML as a planning and prediction aid. To anticipate crucial business variables like sales, revenue, costs, commodity pricing, agent commission, etc., a model can be trained using historical data. Right now, learn how to apply AutoML/Advanced ML to improve your forecast.
Background
Prediction is one of the most often application of machine learning. You can use it to predict future income, costs, and even commodity prices.
Prediction is difficult as well. Traditional methods need a lot of human labour, data engineering skills, and statistical expertise. Using an analysis podium, even non-technical teams may predict values quickly and affordably.
In the parts that follow, we'll examine how to develop and use a predictive regression model to predict price of residential properties. The price of house properties has a significant impact on real estate builders, rent fixation, investment allocation etc. As a result, predicting price of residential properties is crucial.
A key use-case that affects the company's strategy for determining budgetary allocation towards real estate is the prediction of house prices. These predictions are useful for anyone from commercial to individual purposes.
Data in hand
A dataset of house prices serves as the historical data in this instance. The dataset includes past information on residential property prices as well as other pertinent information.
Our target column is “price” and we can use machine learning to predict property prices for a new set of residential houses.
For demo purposes, this dataset has already been uploaded to Aclysis. But by just selecting "Connect Data Source," you can upload whatever dataset you desire.
We'll look at how to create and use a predicting model below. You must first log in with us. The home page will appear as.

Once you click "Add New Model" on the home page, the interface shown below will appear.

Then, upload the dataset by clicking "Import Table." When it is uploaded, you will receive a scrollable preview of the dataset along with an overview that includes the number of rows, columns, the dataset name, the most recent upload date, and the distribution of each variable. To move on to the following step, click "Save & Continue."

Building the Model
We can now select the second step, "Manipulate Data," to rename columns, remove unnecessary features and duplicate rows, treat outliers, etc. The display will be

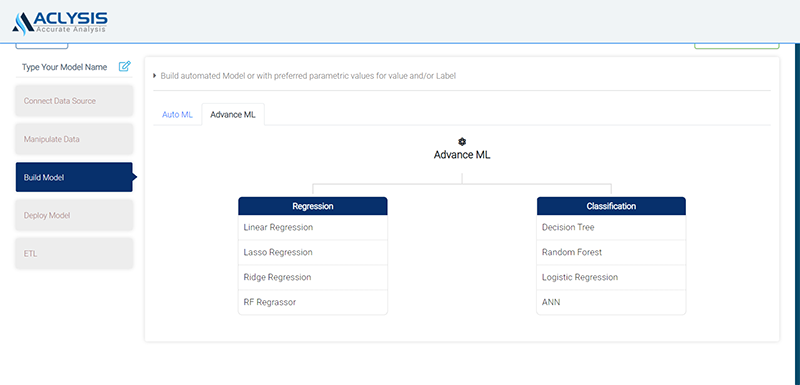
To continue to step 3, "Model Result," where a model is built and results are obtained, click "Save & Continue." You must pick the features you wish to use to build the model and the target variable in this phase. You will have a variety of model choices to consider. Before running the Advanced Model, you will be required to select the parameter values.
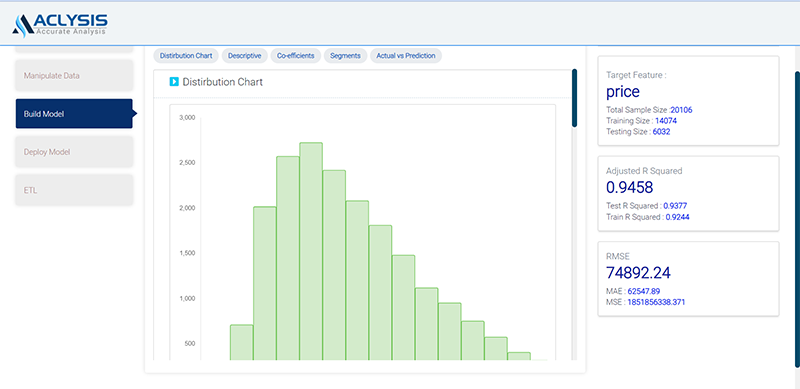
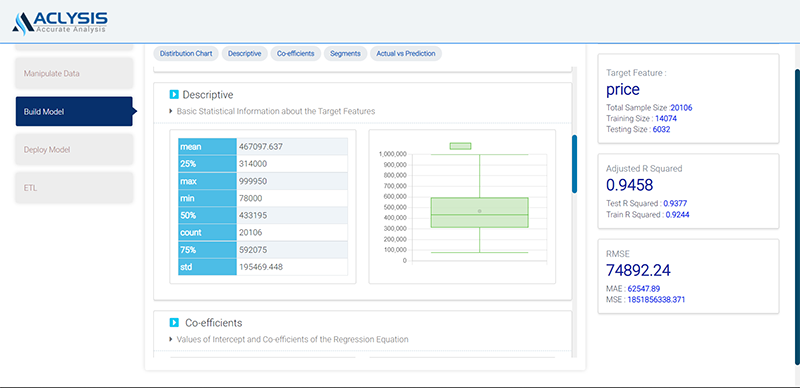
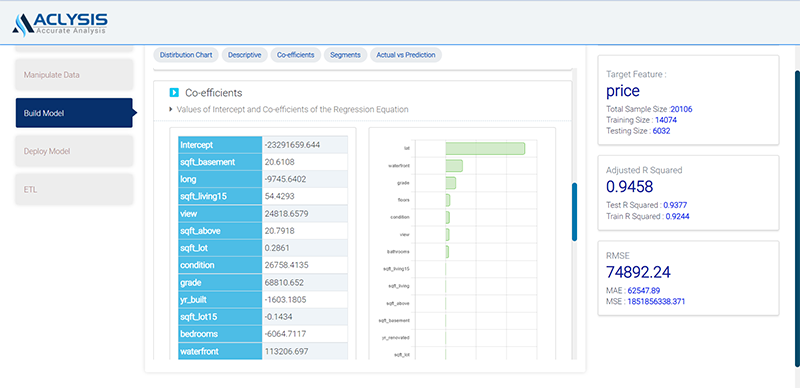
As soon as you submit the form, the model will automatically build, and you will see the following display with model accuracy and various visuals, such as the target variable distribution and dispersion, coefficients and their significance, segmentations, and an accurate vs. prediction plot, among other things.
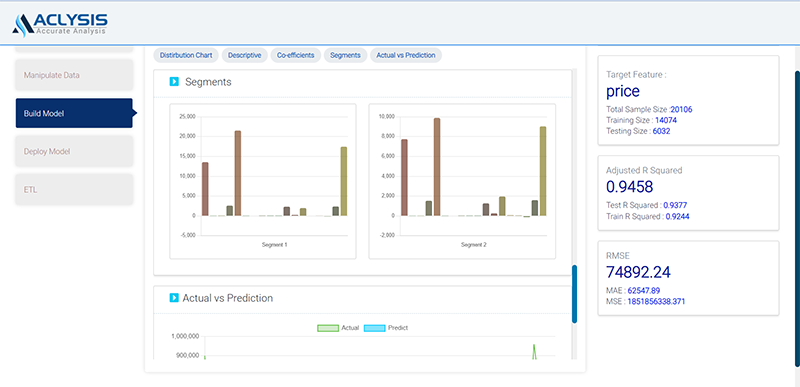
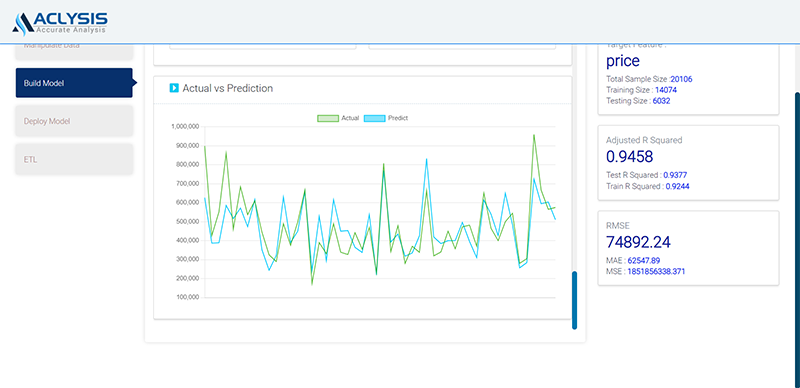
Additionally, keep in mind that, unlike many commonly used automated machine learning programmes, you are not required to pay for model training time, so feel free to create as many models as you like. In conclusion, we have found that it is relatively simple to construct a very accurate prediction model.
Deploying the Model
It's time to use the model we've created in the actual world.
Using Aclysis, deploying sophisticated machine learning models is simple. To deploy using a web app, you click "Deploy Model." For example, if you select "Web App," you will be asked to provide feature inputs. As soon as values are provided, the prediction for the target variable is quickly shown. You can upload a file and get the matching forecasts in tabular form instead of entering a single set of numbers. Here is an example of a deployment page with a csv file.
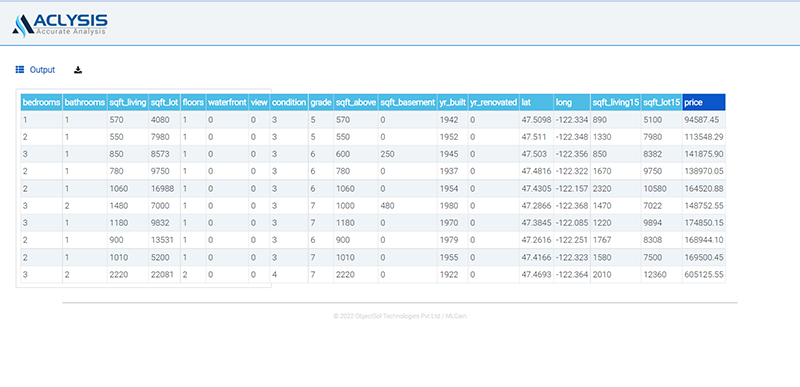
Any numerical feature of your interest can be predicted using the same procedures we used. You can connect historical data to Aclysis, choose a column to forecast, and deploy using a variety of techniques as long as you have the data.