Lead Score and its importance
The technique of assessing a lead's sales readiness using a predetermined approach is known as lead scoring. Any subjectivity can be eliminated from the process and determine which leads have the highest likelihood of converting by using a lead scoring system. Lead scoring goes beyond simple marketing tactics. It can increase the productivity of the company and facilitate team alignment across many departments.
Insurance companies usually incur a lot of expenses towards contacting new customers for insurance sale. It has become a challenge to acquire new customers due to stiff market competitions in the current situation. Hence, it is imperative for them to develop a model through which they can identify potential customers so that they can proactively campaign their sale and protect revenue loss.
Why ACLYSIS ?
Prediction is one of the most often used uses of machine learning. You can use it to predict future income, costs, commodity prices, success / failure rate, lead score etc.
Even making predictions is challenging. Traditional approaches require a significant amount of human labour, data engineering experience, and statistical knowledge. Even non-technical teams can forecast values rapidly and economically by using an analytical podium.
In the parts that follow, we'll examine how to develop and use a predictive model from a dataset of an insurance sales lead by using our AutoML platform with some simple clicks.
A key use-case that affects the company's strategy for determining potential customers. These predictions can be used by anyone to design their campaign or business promotion.
Data in hand
The data consists of sale details of 36153 users of an insurance company. Information is provided across 9 columns. Among those, ‘’saleflag’’ is our target / dependent variable and we can use machine learning to predict insurance sale possibility for a new set of individuals.
For demo purposes, this dataset has already been uploaded to Aclysis. But by just selecting "Connect Data Source," you can upload whatever dataset you desire.
We'll look at how to create and use a predicting model below. You must first log in with us. The home page will appear as.

Once you click "Add New Model" on the home page, the interface shown below will appear.

Then, upload the dataset by clicking "Import Table." When it is uploaded, you will receive a scrollable preview of the dataset along with an overview that includes the number of rows, columns, the dataset name, the most recent upload date, and the distribution of each variable. To move on to the following .
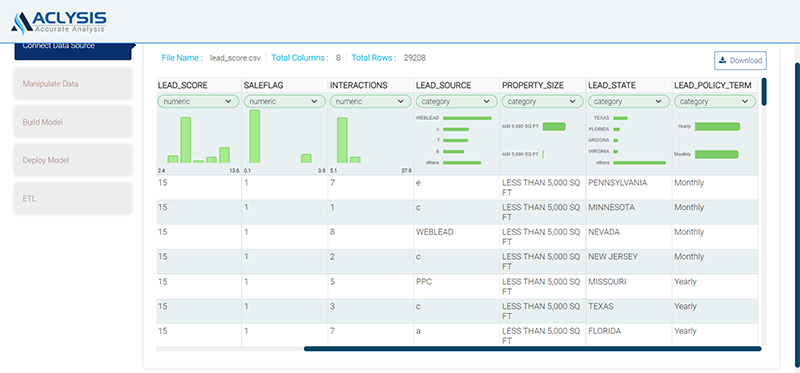
step, click "Save & Continue."
Building the Model
We can now select the second step, "Manipulate Data," to rename columns, remove unnecessary features and duplicate rows, treat outliers, etc. The display will be
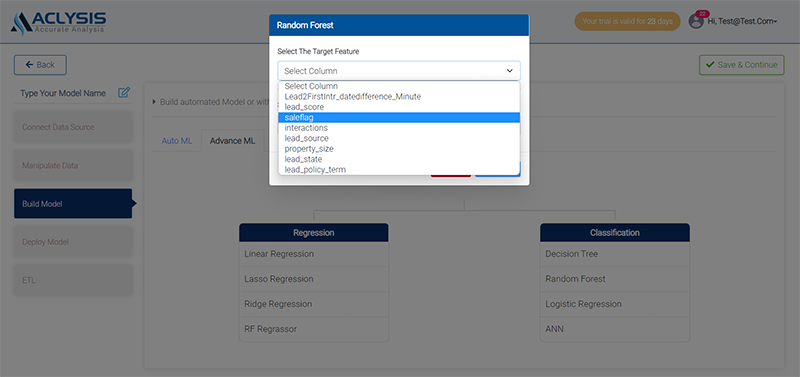
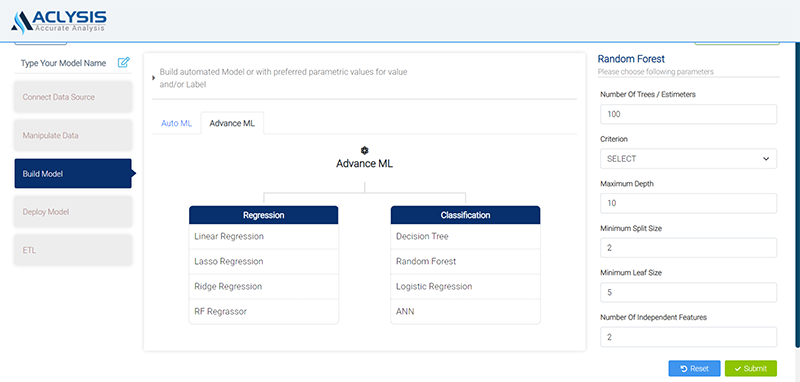
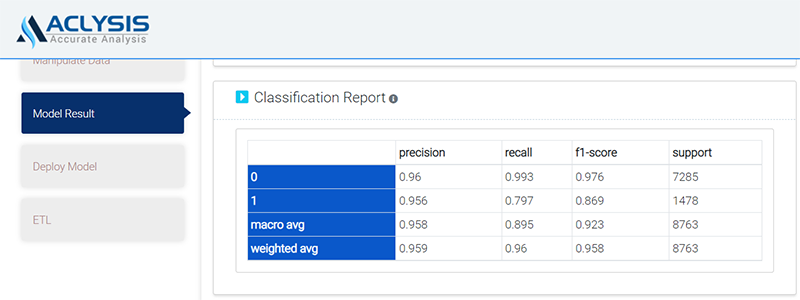
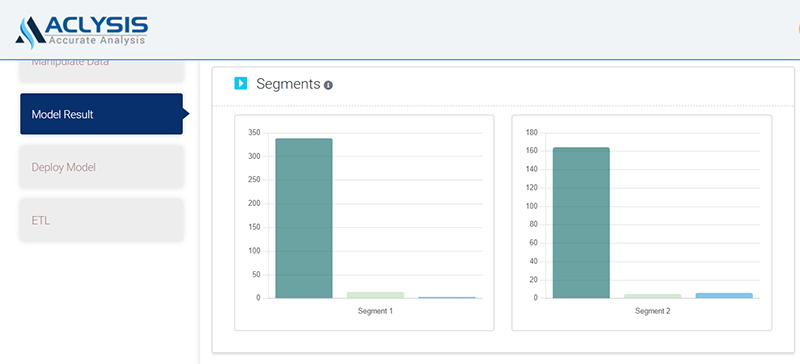
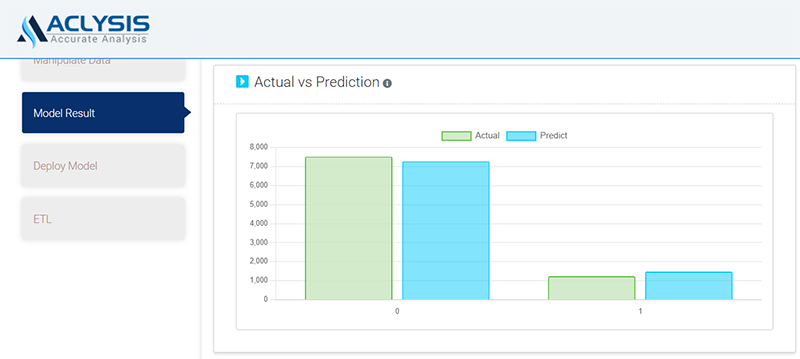
To continue to step 3, "Model Result," where a model is built and results are obtained, click "Save & Continue." You must pick the features you wish to use to build the model and the target variable in this phase. You will have a variety of model choices to consider. Before running the Advanced Model, you will be required to select the parameter values. As soon as you submit the form, the model will automatically build, and you will see the following display with model accuracy and various visuals, such as the target variable distribution and
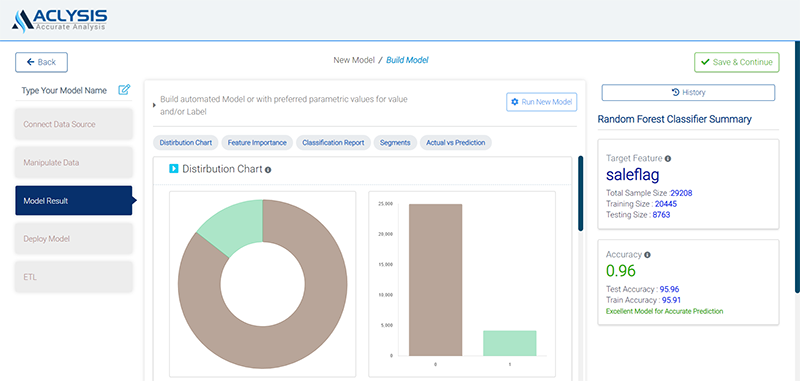
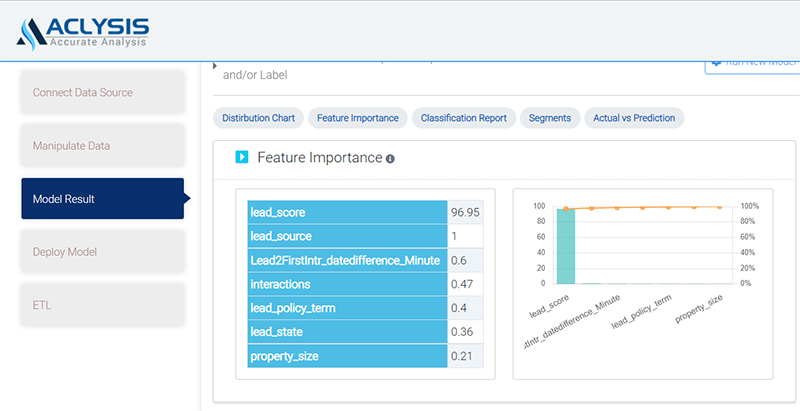
dispersion, feature importance, segmentations, classification report, confusion matrix and an accurate vs. prediction plot, among other things.
Additionally, keep in mind that, unlike many commonly used automated machine learning programmes, you are not required to pay for model training time, so feel free to create as many models as you like. In conclusion, we have found that it is relatively simple to construct a very accurate prediction model.
Deploying the Model
It's time to use the model we've created in the actual world.
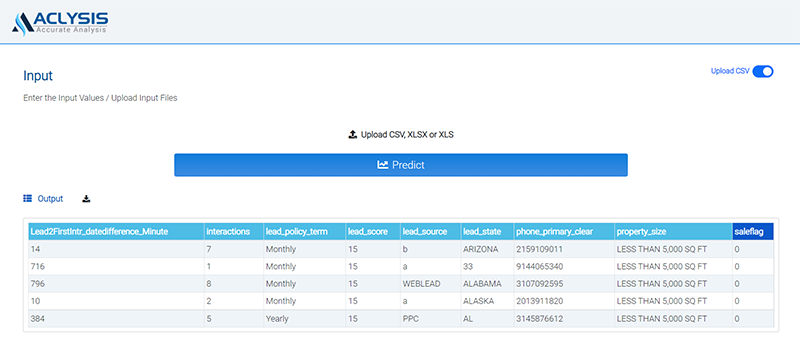
Using Aclysis, deploying sophisticated machine learning models is simple. To deploy using a web app, you click "Deploy Model." For example, if you select "Web App," you will be asked to provide feature inputs. As soon as values are provided, the prediction for the target variable is quickly shown. You can upload a file and get the matching forecasts in tabular form instead of entering a single set of numbers. Here is an example of a deployment page with a single value:
Any categorical feature of your interest can be predicted using the same procedures we used. You can connect historical data to Aclysis, choose a column to forecast, and deploy using a variety of techniques as long as you have the data.